The strategy

Sweep, divergence, inversion.

One setup, traded the same way every day in the New York session. Price sweeps a key level, RSI diverges, and the entry comes when price inverts the gap it left behind. Every step below has to be there before I enter.

Markets MNQ · MESSession New York, from 09:30 ET
SCHEMATIC · SHORT AT PDHRSI + MAVOLUMEFVG → invertedPDH · liquiditySTOP · above the highTARGETHHSHORT on the close →RSI — gold · MA — dashedLHLL123456
The short, at the previous day high. 1 price sweeps PDH, 2 price makes a higher high while RSI makes a lower high, 3 volume fades into the high, 4 price closes back down through the gap it left on the way up, 5 RSI breaks to a lower low and 6 sits below its moving average. Short on that close, stop above the high.
01

Liquidity taken

Where the trade starts
Price has to sweep a key level first. No sweep, no trade. Tick the level it took.
PWH / PWLPDH / PDLLondon H / LAsia H / LOVN H / LEQH / EQLPrev HR H / L
02

RSI divergence

The tell
For a sell, price makes a higher high (HH) on the chart while RSI makes a lower high (LH). For a buy it's the reverse: a lower low (LL) on the chart and a higher low (HL) on RSI. Price stretched further, but momentum didn't follow.
03

Volume divergenceOptional

Extra confluence
Volume fading into the sweep backs up the RSI read. Useful, but not required to take the trade.
04

Inversion

The trigger
Price closes back through the fair value gap it left on the way into the level, turning it against the old direction. This is the entry. Not every inversion counts. It has to come after the sweep and divergence.
05

Creates LL / HH on RSI

Structure check
RSI itself breaks its last swing in the new direction after the sweep, so the momentum shift shows on the oscillator and not just on price. This can be in place before the inversion or come just after it.
06

RSI above / below its MA

Confirmation
For longs RSI is back above its moving average, for shorts below. Like step 05, it can line up before or just after the inversion. If RSI is still on the wrong side, wait.

If you keep taking any old inversion and wondering why it fails, this list is the fix. The inversion is the trigger, not the confirmation. It only counts once the sweep and divergence come before it, and RSI backs it up.

Trade breakdown

A real short, step by step.

Every rule above on one chart. Tap a number on the chart or a step in the list to see where it happens.
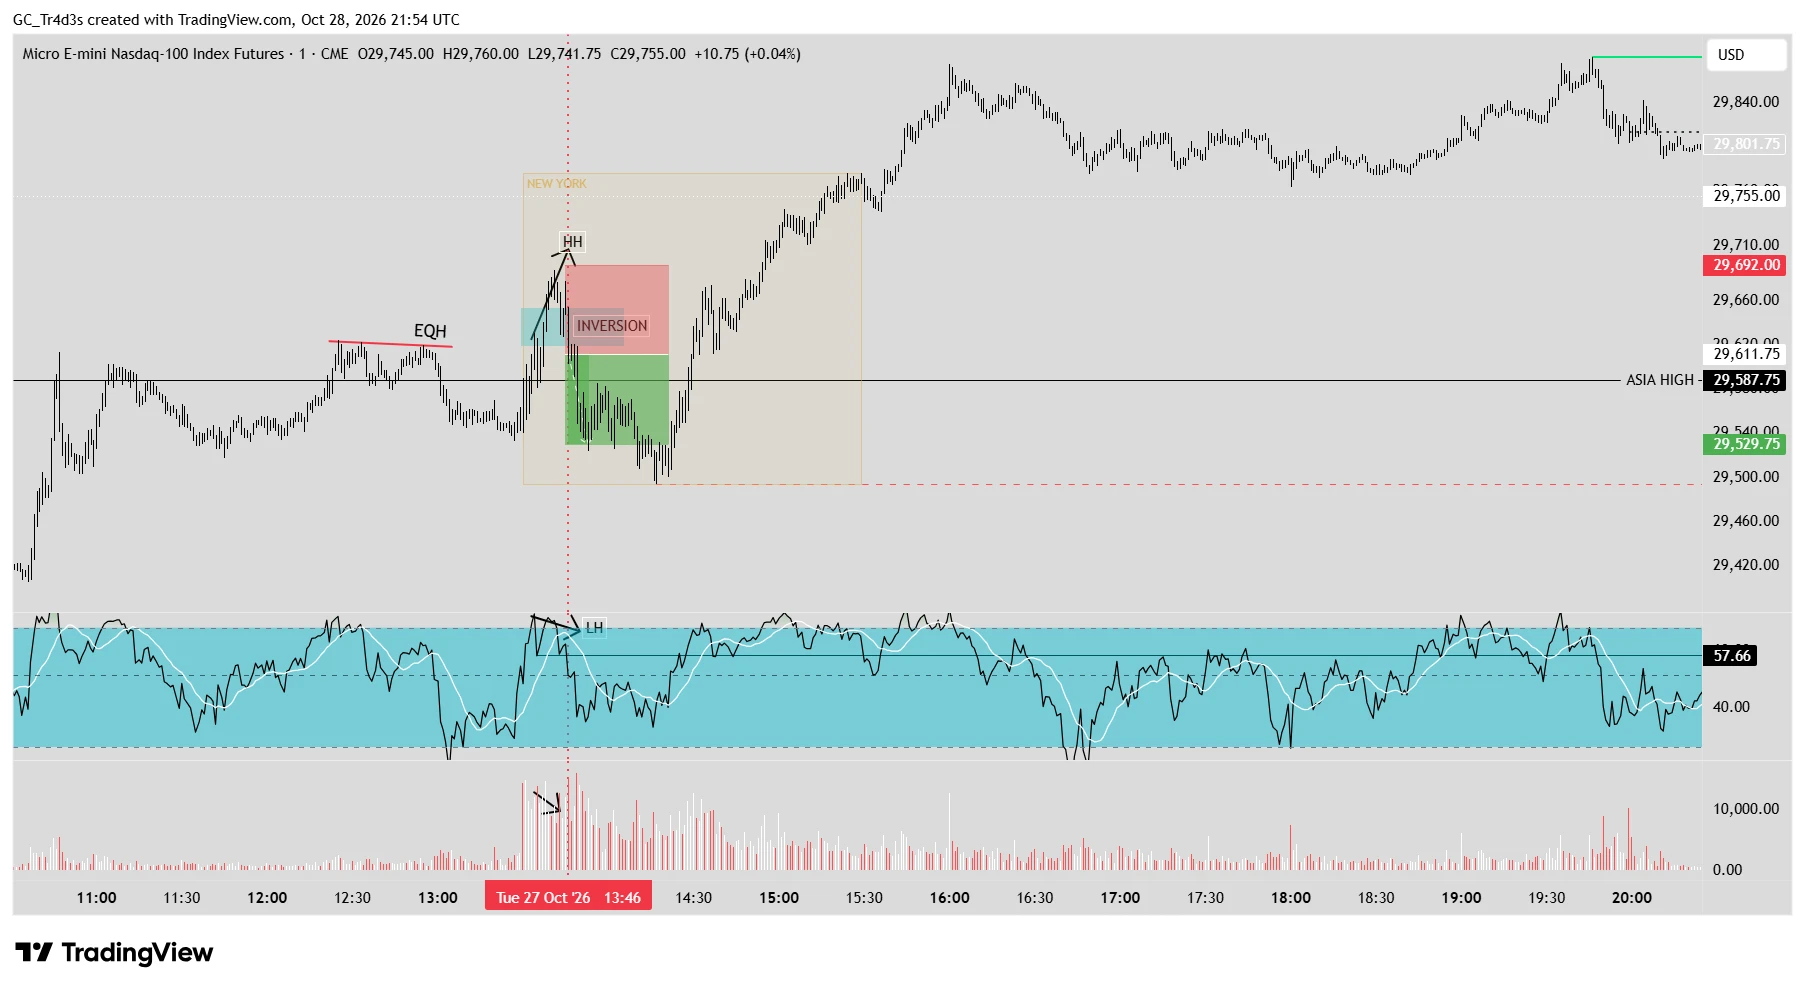
Market MNQ · 1 minDate Tue 27 Oct 2026Direction ShortLevel Equal highs
MNQ 1-minute chart, 27 October 2026. Price sweeps the equal highs to a higher high while RSI makes a lower high and volume fades, then inverts the gap and falls to around 29,500.
MNQ 1-minute, 27 Oct 2026. Times on the chart are UK time.
  1. 1

    Liquidity taken

    Equal highs

    Just after the New York open, price sweeps the equal highs.

  2. 2

    RSI divergence

    Price HH · RSI LH

    Price makes a higher high while RSI makes a lower high.

  3. 3

    Volume divergence

    Fading into the high

    Volume fades into the high.

  4. 4

    Inversion

    The trigger

    Price closes back down through the gap it left on the way up. That close is the entry.

  5. 5

    Creates LL on RSI

    Structure check

    RSI breaks below its last swing low.

  6. 6

    RSI below its MA

    Final filter

    RSI sits under its moving average. Every box ticked: short.

  7. ✓

    Targets hit